Tools
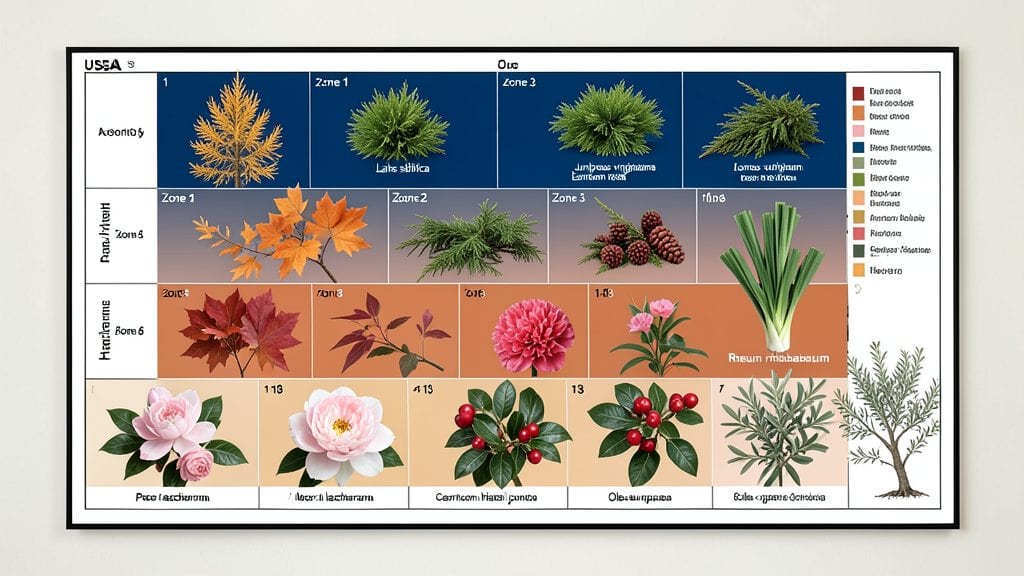
US gardening zones determine which plants thrive in your area by measuring average minimum winter temperatures, ranging from Zone 1 (coldest) to Zone 13 (warmest). Use the USDA Plant Hardiness Zone Map to find your zone by entering your ZIP code or location, then match plants to your specific zone for successful growth.
These zones help gardeners select plants that can survive your region's coldest winters, which is critical for long-term success. The USDA updated its map in 2024 to reflect climate shifts, making zones more accurate for modern gardening.
For example, Zone 7b in the Midwest might now be Zone 8a due to rising temperatures. Microclimates—like a sunny south-facing wall—can also create warmer pockets where tender plants might thrive outside their official zone. 🌱
Beyond winter hardiness, understanding your zone also helps with planting timing and pest management. Many nurseries label plants with their recommended zones, but always double-check local growing conditions.
If you're in a transition area (like between Zone 6 and 7), consider testing plants in containers first to see how they handle your climate before committing to permanent beds.
💡 In This Article
- How USDA Plant Hardiness Zones Work
- Finding Your Zone: Step-by-Step Guide
How USDA plant hardiness zones work
The USDA Plant Hardiness Zone Map divides North America into 13 main zones (1-13) based on the average annual minimum winter temperature over a 30-year period. Each zone represents a 10°F increment, with Zone 1 experiencing temperatures as low as -60°F and Zone 13 maintaining 60-70°F winters.
This system helps gardeners predict which plants can survive winter dormancy in their region, as most plants have a critical temperature threshold below which they suffer irreversible damage.
The science behind these zones relies on thermal physiology—how plants respond to cold stress. For example, deciduous trees like maples can tolerate down to -30°F (Zone 4), while citrus trees in Zone 10 need protection from below 32°F.
The 2024 map revision incorporated 1991-2020 climate data, shifting many areas northward by half a zone due to climate change. This means a plant once considered safe in Zone 6b might now struggle in areas that have warmed into Zone 7a.
Microclimates create local variations within the same zone. A south-facing wall can add 5-10°F of warmth, allowing Zone 5 plants to thrive in Zone 4 areas. Conversely, low-lying areas or urban "heat islands" (where pavement absorbs heat) can push temperatures 2-5°F higher than official zone averages.
Elevation also plays a role—every 1,000 feet up increases cold exposure by about 3.5°F, which is why mountain gardens may need plants rated for one zone colder than their base elevation.
Global comparisons show similar systems exist worldwide, like the Royal Horticultural Society (RHS) hardiness ratings in the UK, which use Celsius-based bands (e.g., H7 for -15° to -10°C). However, the USDA system's 10°F increments provide finer granularity for large-scale agriculture.
The key takeaway: while zones offer a baseline, real-world growing success depends on local microclimates, soil conditions, and plant-specific resilience.
Here's what most gardeners overlook: half-zones (a/b) matter more than you think. A Zone 6a (-10° to -5°F) plant may survive in Zone 6b (-5° to 0°F) with winter protection, but not vice versa.
The 2024 map now includes these subdivisions universally, giving gardeners more precision. For example, a peach tree (Zone 5b) might fail in Zone 5a but thrive in Zone 6a with proper care.
To test your zone's accuracy, monitor your garden's winter lows for 3-5 years—this reveals how your microclimate differs from the official map. I once grew rosemary (Zone 8) successfully in Zone 7b by placing it against a brick wall, proving that local conditions often override zone rules.
The map is a starting point, not an absolute.